Euphony
Sinus in Swing
Life's Tempo- I'll Cue You
In the early 1900s, Dutch physiologist Willem Einthoven revolutionized cardiology by inventing the electrocardiogram (ECG), a device that records the heart’s electrical activity. He labeled the repeating waves P, Q, R, S, and T, creating the system doctors still use today to read the rhythm of the heart. I sometimes like to imagine a playful possibility behind this sequence. Perhaps Einthoven had the alphabet song in mind while observing the pattern—because the rhythm of “P-Q-R-S-T” almost sounds like music, just like the steady beat of the heart.
Learn More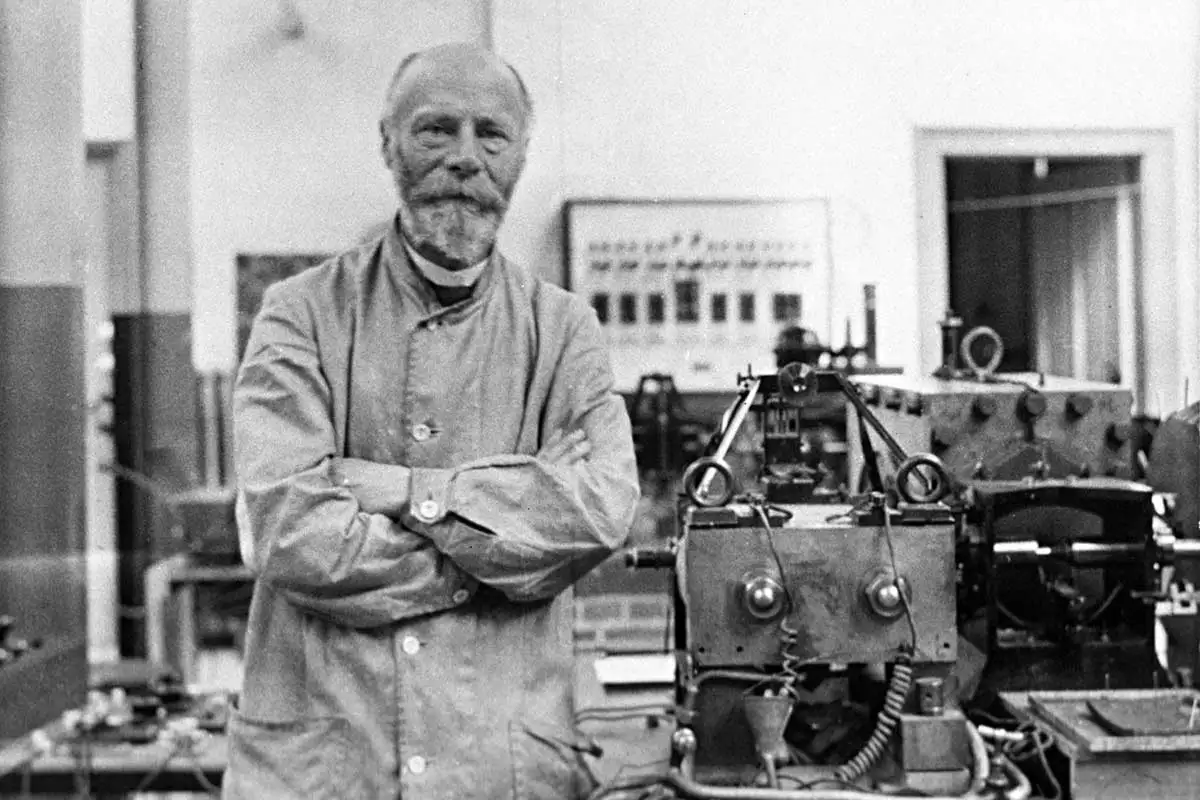
If you listen closely to your heart, you’ll recognize the familiar rhythm: “Lub, Dub.” These are the two basic beats of the heart—S1 and S2. The short interval between them, called systole, is when the heart contracts to pump blood, while the longer pause after S2, diastole, is when the heart relaxes and refills.

The “Lub” sound (S1) occurs when two valves close: the mitral valve, which controls blood flow from the left atrium to the left ventricle, and the tricuspid valve, which separates the right atrium and right ventricle. After the atria push blood into the ventricles, these valves snap shut, producing the first heartbeat sound.
The “Dub” sound (S2) is slightly more complex. It is actually made of two parts: A2, the closing of the aortic valve, and P2, the closing of the pulmonary valve. During exhalation they occur almost together, so we hear one sound. But when we inhale, increased blood flow to the right side of the heart slightly delays the pulmonary valve closure, creating a small separation known as the physiologic split of S2.

In this musical interpretation of the heartbeat, the rhythm begins with S1 (“Lub”), represented by a quarter note, marking the start of the cardiac cycle. This is followed by an eighth rest, representing systole, the short interval between S1 and S2 that lasts about 0.3–0.4 seconds, comparable to the brief pause of half a beat. Next comes S2, the “Dub” sound, illustrated as two rapid 32nd notes representing A2 and P2 during exhalation, when the aortic and pulmonary valves close almost simultaneously within only a few hundredths of a second (~0.02–0.04 s).
After this, diastole follows and is shown as a quarter rest, reflecting the longer relaxation period of the heart, typically 0.7–1 second, when the ventricles refill with blood.
In the next cycle during inhalation, the pattern begins again with a quarter note for S1 and an eighth rest for systole, but this time the A2 and P2 closures separate slightly, illustrated as two distinct 32nd notes, reflecting the small physiologic split of S2 (~0.05 s) that occurs as increased blood flow delays the pulmonary valve closure.
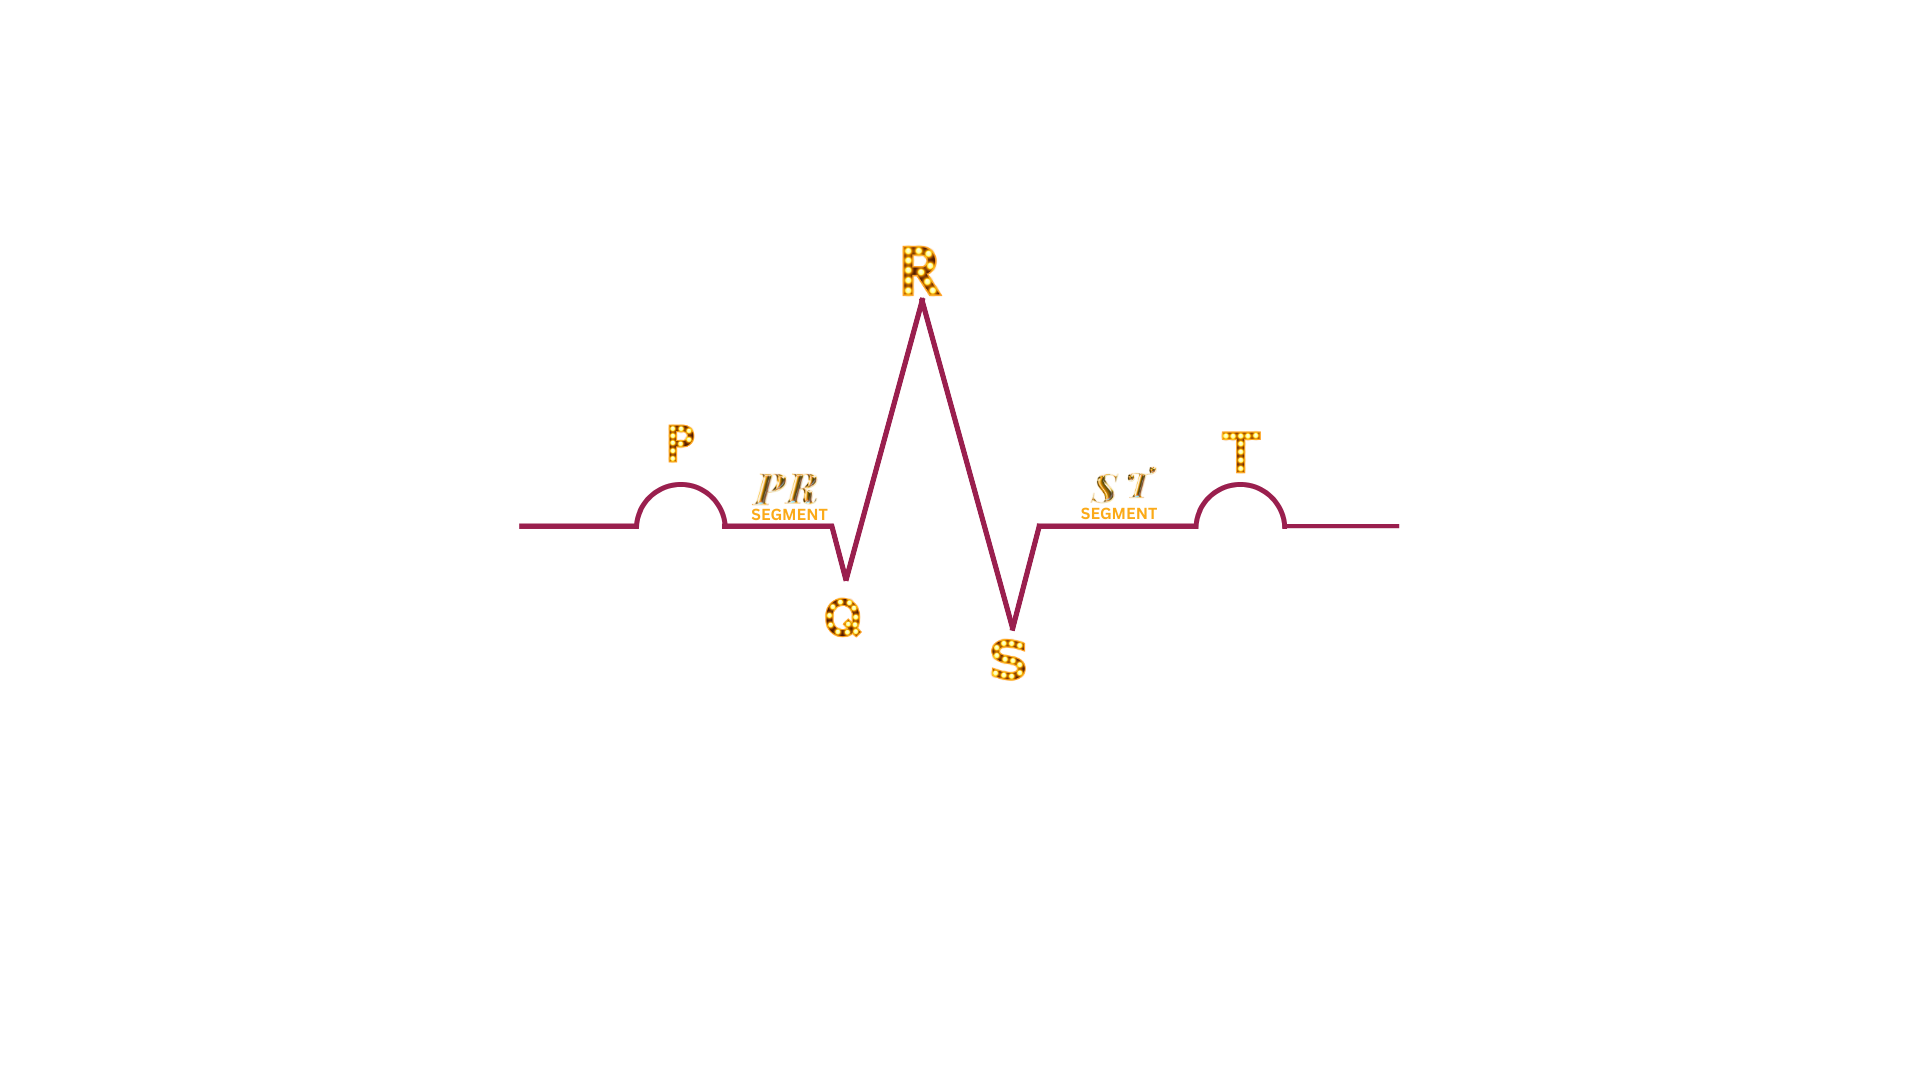
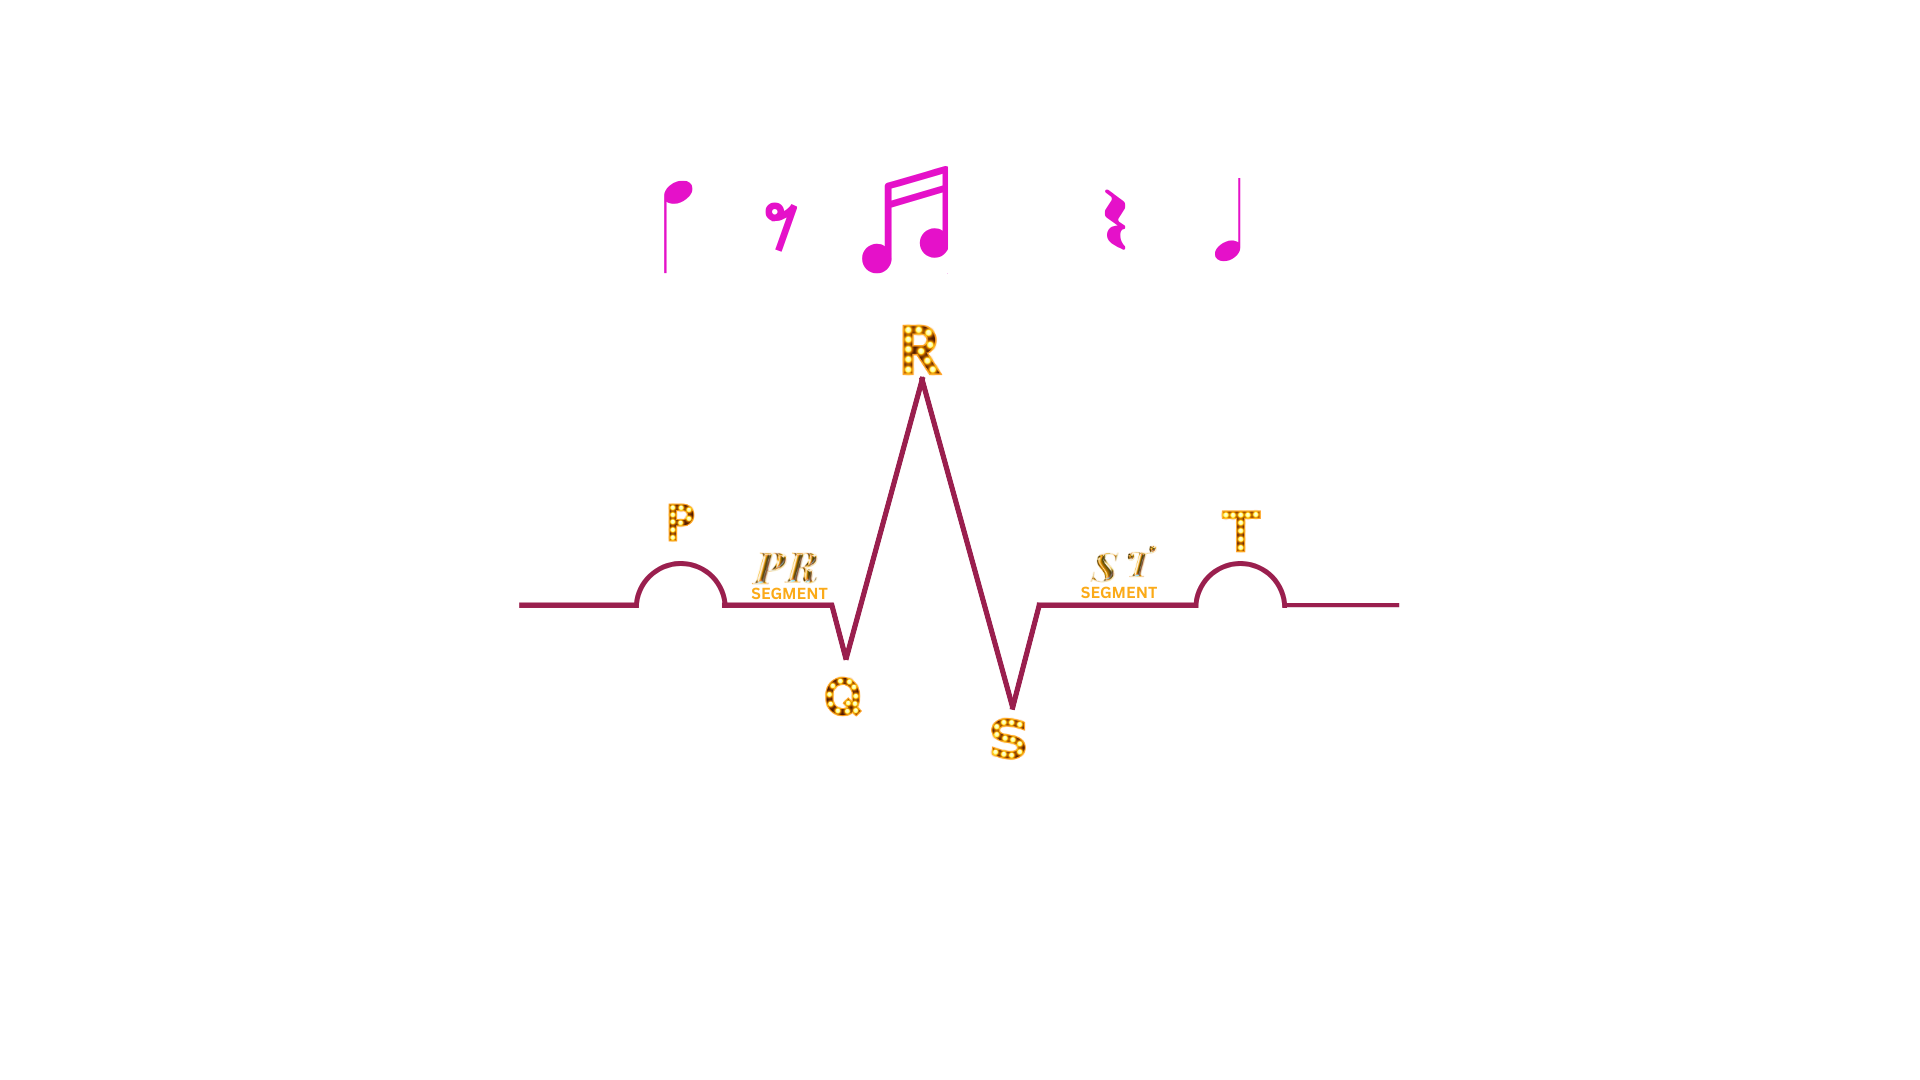
An electrocardiogram (ECG) records the electrical signals that guide the heart’s rhythm. The P wave represents the electrical activation of the atria, causing them to contract and push blood into the ventricles; this phase leads into the first heart sound S1 (“Lub”), produced by the closing of the mitral and tricuspid valves. Following the P wave is the PR segment, a brief delay of about 0.08–0.10 seconds that allows the electrical impulse to travel through the atrioventricular node before reaching the ventricles. The QRS complex, lasting about 0.06–0.10 seconds, represents the rapid activation and contraction of the ventricles, which pump blood out of the heart; shortly after this contraction, the aortic and pulmonary valves close, producing the second heart sound S2 (“Dub”). Afterward comes the ST segment, usually lasting around 0.08–0.12 seconds, a short period when the ventricles remain fully contracted before beginning recovery. Finally, the T wave represents ventricular relaxation, followed by a brief pause before the next heartbeat begins.


You wouldn’t sing it as one continuous string like “ABCDEFGHIJKLMNOPQRS.” Instead, there is a natural pause after “P” before continuing to “Q.” This pause resembles the PT segment on an ECG—the flat segment between the P wave and the Q wave, where no electrical activity is detected.
Once the rhythm reaches “Q,” the letters Q–R–S follow quickly without interruption, just like the QRS complex, which represents the rapid electrical activity during ventricular contraction. After “S,” another brief pause appears before “T,” similar to the ST segment, when the heart begins its recovery phase.
Of course, it’s very unlikely that Willem Einthoven chose the letters P–Q–R–S–T because of the alphabet song. In fact, he likely borrowed the notation from mathematical conventions used to label points or curves. However, it's fun to think this way next time we look at ECG's and recognize what they mean since the patterns of each match perfectly!